
Multi-dimensional scaling is related to PCA. Basically it translates data points between differently dimensioned spaces, through the use of a similarity metric. Thus the result is a plot in 2- or 3-D similarity space; that is, what you're plotting is the similarity between data points as measured by the metric.
For 2-D plots, you can use the
dist and cmdscale functions of R:#2D
setwd("~/Data/")
getwd()
#Load Data
data <- read.csv("myData.csv", header=TRUE)
#Caclulate Dist.
data.dist <- dist(data[,1:4])
#Calculate MDS
data.mds <- cmdscale(data.dist, k=2)
#Create x,y refs
data.x <- data.mds[,1]
data.y <- data.mds[,2]
#Plot
plot(data.x, data.y, col=as.integer(data$CLASS))
setwd("~/Data/")
getwd()
#Load Data
data <- read.csv("myData.csv", header=TRUE)
#Caclulate Dist.
data.dist <- dist(data[,1:4])
#Calculate MDS
data.mds <- cmdscale(data.dist, k=2)
#Create x,y refs
data.x <- data.mds[,1]
data.y <- data.mds[,2]
#Plot
plot(data.x, data.y, col=as.integer(data$CLASS))
this results in a plot like this:
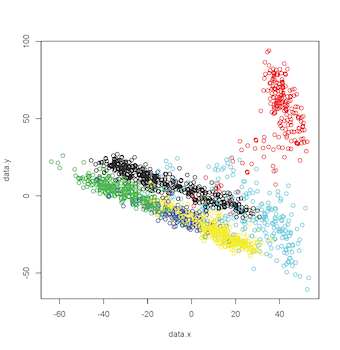 | |
| 2-D MDS Plot |
3-D plotting relies on the amazing
rgl library. Which, on MacOS, I believe requires X11 to be installed. The code for this is very similar, except in the call to cmdscale, k equals 3, there is an additional axis, and a call to plot3d (rgl library call):#3D
library(rgl)
setwd("~/Data/")
getwd()
#Load Data
data <- read.csv("myData.csv", header=TRUE)
#Caclulate Dist.
data.dist <- dist(data[,1:4])
#Calculate MDS
data.mds <- cmdscale(data.dist, k=3)
#Create x,y refs
data.x <- data.mds[,1]
data.y <- data.mds[,2]
data.z <- data.mds[,3]
#Plot
plot3d(data.x, data.y, data.z, col=as.integer(data$CLASS))
which result in a plot like this: library(rgl)
setwd("~/Data/")
getwd()
#Load Data
data <- read.csv("myData.csv", header=TRUE)
#Caclulate Dist.
data.dist <- dist(data[,1:4])
#Calculate MDS
data.mds <- cmdscale(data.dist, k=3)
#Create x,y refs
data.x <- data.mds[,1]
data.y <- data.mds[,2]
data.z <- data.mds[,3]
#Plot
plot3d(data.x, data.y, data.z, col=as.integer(data$CLASS))
 | |
| 3-D MDS Plot |
#Animate by spinning on Y & Z axes play3d(spin3d(axis=c(0,1,1), rpm=3), duration=30)
Additionally, by changing play3d to movie3d and adding a movie = "namewithnoext" argument you can produce animated gifs of your 3D plot: | |
| Animated 3-D MDS Plot |
Data from SatLog dataset, from the UCI Machine Learning Repository