I am chronically bad at keeping blogs up-to-date, but I am in the process of creating a new site to share some of my more scholarly work.
I am very excited to share a number of new projects, processes, and ideas.

The Explorations of a Curious Mind
Thursday, January 19, 2017
24 Selected TED Talks
This post was too long. So I made it a separate page. Now with summary notes! (My takeaways in more or less the speakers words, from the official transcripts.)
This diagram shows just a couple of the cross-links that may not be immediately obvious.
Enjoy!

This diagram shows just a couple of the cross-links that may not be immediately obvious.
Enjoy!
Friday, December 12, 2014
Magnetic Words: Firefly-inspired Chinese Words & Phrases
While doing some Christmas shopping at ThinkGeek I looked at their Firefly Magnetic prose and was disappointed by their rendering of the Chinese (Mandarin) phrases included. (Of course, the Chinese used in Firefly is 25th century Chinese, so it could be Anglicized, but that isn't quite as fun). So I made my own:

And so can you: Words and phrases file (PDF), English-Chinese List, Chinese (by Pinyin)-English List. You’ll also need a pair of scissors and some adhesive-backed magnetic sheets such as those by MagPro [e.g. amazon] (also available at Michael’s arts & craft stores).
These PDFs are creative commons licensed. Attribution, Non-Commercial, Share-Alike
Tuesday, July 8, 2014
2112 in Mayan
The other day I was browsing a book on Mayan Civilization and Archeology and was reading about their base-20 number system and how it was juxtaposed to their calendar system in terms of complexity. I started to play a bit with the number system (I love messing about mathematically in different bases — place-value systems are so brilliant!). Thinking of the prog-rock band Rush’s palindromic album title, 2112, I quickly converted in my head and came to a surprising conclusion:
The number twenty-one twelve is a palindrome in both Hindu-Arabic base-ten numerals: 


Saturday, June 7, 2014
Vectors for Custom Map(s) of Portland (Maine)
The other day I started working on a cartography project that I have been thinking about for some time: A Personalized Map of Portland, Maine. I've only spent a couple hours digitizing off of aerial imagery from MEGIS. Originally, I wanted to use 3-inch resolution imagery, but it just was too much data, so I reduced the 3-in mosaic to a 12-in resolution mosaic. The 12-in image was better, but the image dimensions exceeded Illustrator's size limits on placed images, so I proportionally reduced it in Photoshop, so it's now about 14-in resolution imagery. In any case, I started digitizing I have two draft results:

Next I wanted to experiment with some more detail, so I started working on a map of the University of Southern Maine's Portland Campus, I have roughed out green spaces and buildings in about two hours. The draft results look a little too cartoonish, which might work in the school paper for orientation week, but is just not the look I was going for, so I need to spend some more time tidying up and generalizing; — it also needs labels.

Next I wanted to experiment with some more detail, so I started working on a map of the University of Southern Maine's Portland Campus, I have roughed out green spaces and buildings in about two hours. The draft results look a little too cartoonish, which might work in the school paper for orientation week, but is just not the look I was going for, so I need to spend some more time tidying up and generalizing; — it also needs labels.
Friday, May 9, 2014
Basic 2D & 3D Multi-dimensional scaling (MDS) in R
A couple of weeks ago I needed to examine several thousand 4-dimensional data points for separability. I turned to R and MDS to help me explore the data.
Multi-dimensional scaling is related to PCA. Basically it translates data points between differently dimensioned spaces, through the use of a similarity metric. Thus the result is a plot in 2- or 3-D similarity space; that is, what you're plotting is the similarity between data points as measured by the metric.
For 2-D plots, you can use the
this results in a plot like this:
3-D plotting relies on the amazing
which you can even animate by adding:
Multi-dimensional scaling is related to PCA. Basically it translates data points between differently dimensioned spaces, through the use of a similarity metric. Thus the result is a plot in 2- or 3-D similarity space; that is, what you're plotting is the similarity between data points as measured by the metric.
For 2-D plots, you can use the
dist and cmdscale functions of R:#2D
setwd("~/Data/")
getwd()
#Load Data
data <- read.csv("myData.csv", header=TRUE)
#Caclulate Dist.
data.dist <- dist(data[,1:4])
#Calculate MDS
data.mds <- cmdscale(data.dist, k=2)
#Create x,y refs
data.x <- data.mds[,1]
data.y <- data.mds[,2]
#Plot
plot(data.x, data.y, col=as.integer(data$CLASS))
setwd("~/Data/")
getwd()
#Load Data
data <- read.csv("myData.csv", header=TRUE)
#Caclulate Dist.
data.dist <- dist(data[,1:4])
#Calculate MDS
data.mds <- cmdscale(data.dist, k=2)
#Create x,y refs
data.x <- data.mds[,1]
data.y <- data.mds[,2]
#Plot
plot(data.x, data.y, col=as.integer(data$CLASS))
this results in a plot like this:
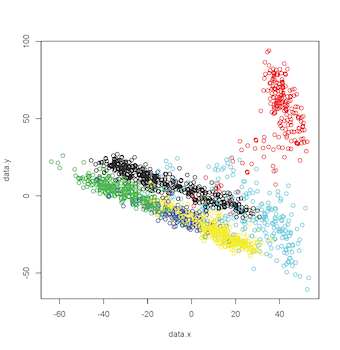 | |
| 2-D MDS Plot |
3-D plotting relies on the amazing
rgl library. Which, on MacOS, I believe requires X11 to be installed. The code for this is very similar, except in the call to cmdscale, k equals 3, there is an additional axis, and a call to plot3d (rgl library call):#3D
library(rgl)
setwd("~/Data/")
getwd()
#Load Data
data <- read.csv("myData.csv", header=TRUE)
#Caclulate Dist.
data.dist <- dist(data[,1:4])
#Calculate MDS
data.mds <- cmdscale(data.dist, k=3)
#Create x,y refs
data.x <- data.mds[,1]
data.y <- data.mds[,2]
data.z <- data.mds[,3]
#Plot
plot3d(data.x, data.y, data.z, col=as.integer(data$CLASS))
which result in a plot like this: library(rgl)
setwd("~/Data/")
getwd()
#Load Data
data <- read.csv("myData.csv", header=TRUE)
#Caclulate Dist.
data.dist <- dist(data[,1:4])
#Calculate MDS
data.mds <- cmdscale(data.dist, k=3)
#Create x,y refs
data.x <- data.mds[,1]
data.y <- data.mds[,2]
data.z <- data.mds[,3]
#Plot
plot3d(data.x, data.y, data.z, col=as.integer(data$CLASS))
 | |
| 3-D MDS Plot |
#Animate by spinning on Y & Z axes play3d(spin3d(axis=c(0,1,1), rpm=3), duration=30)
Additionally, by changing play3d to movie3d and adding a movie = "namewithnoext" argument you can produce animated gifs of your 3D plot: | |
| Animated 3-D MDS Plot |
Data from SatLog dataset, from the UCI Machine Learning Repository
Sunday, May 12, 2013
Physical Color Space
While working on the GIS project I described in this post, I had a presentation conundrum: how do I communicate my mapping of RGB (Red, Green, Blue (additive)) color space to ideology symbology to an audience that may or may not have only a passing acquaintance with the physics of color and how it relates to our current computer technology. To solve this issue, I decided I could physically model RGB space as a cube.
The cube allows one to examine the outer surface of the RGB space; as well as illustrating the relationship between additive and subtractive spaces. In terms of my ideological representation issue, I was able to communicate that the 3-axes used to represent Red, Green, and Blue values could be relabeled to represent the percent of the vote supporting Conservative, Alternative, and Liberal ideologies.


Licensed under Creative Commons: BY-NC-SA
The cube allows one to examine the outer surface of the RGB space; as well as illustrating the relationship between additive and subtractive spaces. In terms of my ideological representation issue, I was able to communicate that the 3-axes used to represent Red, Green, and Blue values could be relabeled to represent the percent of the vote supporting Conservative, Alternative, and Liberal ideologies.
Now I’m sharing, so you can make your own. You’ll need:
- a color printer or access to one.
- some poster board or other heavy (but flexible) art board
- an Xacto knife or other cutting implement.
- a ruler
- a pencil
- glue-stick, or other paper adhesive.
After printing, cut out and trace on to the art board one of the following PDFs (remember to add tabs if using the original PDF):
- Here’s the original PDF;
- and if you want to hide the edges, here’s one with tabs.
Next, you’ll cut out and fold the art board into a cube being sure to tuck the tabs in, so you have a more-or-less smooth external surface.
Then you’ll want to do the same with the color print-out, only this time gluing it to the art board cube you’ve assembled. (Again, remember to tuck any tabs underneath.)
Optionally, you may attempt to cover your creation with a protective covering (this usually doesn’t go as well as one would like — I wrapped mine in packing tape, but it got blisters and a tiny patch of color torn, etc.)
Cube size is approx. 2.75"^3Licensed under Creative Commons: BY-NC-SA
Subscribe to:
Posts (Atom)