I am chronically bad at keeping blogs up-to-date, but I am in the process of creating a new site to share some of my more scholarly work.
I am very excited to share a number of new projects, processes, and ideas.

The Explorations of a Curious Mind
Thursday, January 19, 2017
24 Selected TED Talks
This post was too long. So I made it a separate page. Now with summary notes! (My takeaways in more or less the speakers words, from the official transcripts.)
This diagram shows just a couple of the cross-links that may not be immediately obvious.
Enjoy!

This diagram shows just a couple of the cross-links that may not be immediately obvious.
Enjoy!

Friday, December 12, 2014
Magnetic Words: Firefly-inspired Chinese Words & Phrases
While doing some Christmas shopping at ThinkGeek I looked at their Firefly Magnetic prose and was disappointed by their rendering of the Chinese (Mandarin) phrases included. (Of course, the Chinese used in Firefly is 25th century Chinese, so it could be Anglicized, but that isn't quite as fun). So I made my own:

And so can you: Words and phrases file (PDF), English-Chinese List, Chinese (by Pinyin)-English List. You’ll also need a pair of scissors and some adhesive-backed magnetic sheets such as those by MagPro [e.g. amazon] (also available at Michael’s arts & craft stores).
These PDFs are creative commons licensed. Attribution, Non-Commercial, Share-Alike
And so can you: Words and phrases file (PDF), English-Chinese List, Chinese (by Pinyin)-English List. You’ll also need a pair of scissors and some adhesive-backed magnetic sheets such as those by MagPro [e.g. amazon] (also available at Michael’s arts & craft stores).
These PDFs are creative commons licensed. Attribution, Non-Commercial, Share-Alike
Tuesday, July 8, 2014
2112 in Mayan
The other day I was browsing a book on Mayan Civilization and Archeology and was reading about their base-20 number system and how it was juxtaposed to their calendar system in terms of complexity. I started to play a bit with the number system (I love messing about mathematically in different bases — place-value systems are so brilliant!). Thinking of the prog-rock band Rush’s palindromic album title, 2112, I quickly converted in my head and came to a surprising conclusion:
The number twenty-one twelve is a palindrome in both Hindu-Arabic base-ten numerals: 


Saturday, June 7, 2014
Vectors for Custom Map(s) of Portland (Maine)
The other day I started working on a cartography project that I have been thinking about for some time: A Personalized Map of Portland, Maine. I've only spent a couple hours digitizing off of aerial imagery from MEGIS. Originally, I wanted to use 3-inch resolution imagery, but it just was too much data, so I reduced the 3-in mosaic to a 12-in resolution mosaic. The 12-in image was better, but the image dimensions exceeded Illustrator's size limits on placed images, so I proportionally reduced it in Photoshop, so it's now about 14-in resolution imagery. In any case, I started digitizing I have two draft results:

Next I wanted to experiment with some more detail, so I started working on a map of the University of Southern Maine's Portland Campus, I have roughed out green spaces and buildings in about two hours. The draft results look a little too cartoonish, which might work in the school paper for orientation week, but is just not the look I was going for, so I need to spend some more time tidying up and generalizing; — it also needs labels.

Next I wanted to experiment with some more detail, so I started working on a map of the University of Southern Maine's Portland Campus, I have roughed out green spaces and buildings in about two hours. The draft results look a little too cartoonish, which might work in the school paper for orientation week, but is just not the look I was going for, so I need to spend some more time tidying up and generalizing; — it also needs labels.
Friday, May 9, 2014
Basic 2D & 3D Multi-dimensional scaling (MDS) in R
A couple of weeks ago I needed to examine several thousand 4-dimensional data points for separability. I turned to R and MDS to help me explore the data.
Multi-dimensional scaling is related to PCA. Basically it translates data points between differently dimensioned spaces, through the use of a similarity metric. Thus the result is a plot in 2- or 3-D similarity space; that is, what you're plotting is the similarity between data points as measured by the metric.
For 2-D plots, you can use the
this results in a plot like this:
3-D plotting relies on the amazing
which you can even animate by adding:
Multi-dimensional scaling is related to PCA. Basically it translates data points between differently dimensioned spaces, through the use of a similarity metric. Thus the result is a plot in 2- or 3-D similarity space; that is, what you're plotting is the similarity between data points as measured by the metric.
For 2-D plots, you can use the
dist and cmdscale functions of R:#2D
setwd("~/Data/")
getwd()
#Load Data
data <- read.csv("myData.csv", header=TRUE)
#Caclulate Dist.
data.dist <- dist(data[,1:4])
#Calculate MDS
data.mds <- cmdscale(data.dist, k=2)
#Create x,y refs
data.x <- data.mds[,1]
data.y <- data.mds[,2]
#Plot
plot(data.x, data.y, col=as.integer(data$CLASS))
setwd("~/Data/")
getwd()
#Load Data
data <- read.csv("myData.csv", header=TRUE)
#Caclulate Dist.
data.dist <- dist(data[,1:4])
#Calculate MDS
data.mds <- cmdscale(data.dist, k=2)
#Create x,y refs
data.x <- data.mds[,1]
data.y <- data.mds[,2]
#Plot
plot(data.x, data.y, col=as.integer(data$CLASS))
this results in a plot like this:
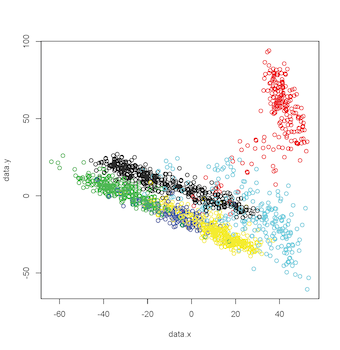 | |
| 2-D MDS Plot |
3-D plotting relies on the amazing
rgl library. Which, on MacOS, I believe requires X11 to be installed. The code for this is very similar, except in the call to cmdscale, k equals 3, there is an additional axis, and a call to plot3d (rgl library call):#3D
library(rgl)
setwd("~/Data/")
getwd()
#Load Data
data <- read.csv("myData.csv", header=TRUE)
#Caclulate Dist.
data.dist <- dist(data[,1:4])
#Calculate MDS
data.mds <- cmdscale(data.dist, k=3)
#Create x,y refs
data.x <- data.mds[,1]
data.y <- data.mds[,2]
data.z <- data.mds[,3]
#Plot
plot3d(data.x, data.y, data.z, col=as.integer(data$CLASS))
which result in a plot like this: library(rgl)
setwd("~/Data/")
getwd()
#Load Data
data <- read.csv("myData.csv", header=TRUE)
#Caclulate Dist.
data.dist <- dist(data[,1:4])
#Calculate MDS
data.mds <- cmdscale(data.dist, k=3)
#Create x,y refs
data.x <- data.mds[,1]
data.y <- data.mds[,2]
data.z <- data.mds[,3]
#Plot
plot3d(data.x, data.y, data.z, col=as.integer(data$CLASS))
 | |
| 3-D MDS Plot |
#Animate by spinning on Y & Z axes play3d(spin3d(axis=c(0,1,1), rpm=3), duration=30)
Additionally, by changing play3d to movie3d and adding a movie = "namewithnoext" argument you can produce animated gifs of your 3D plot: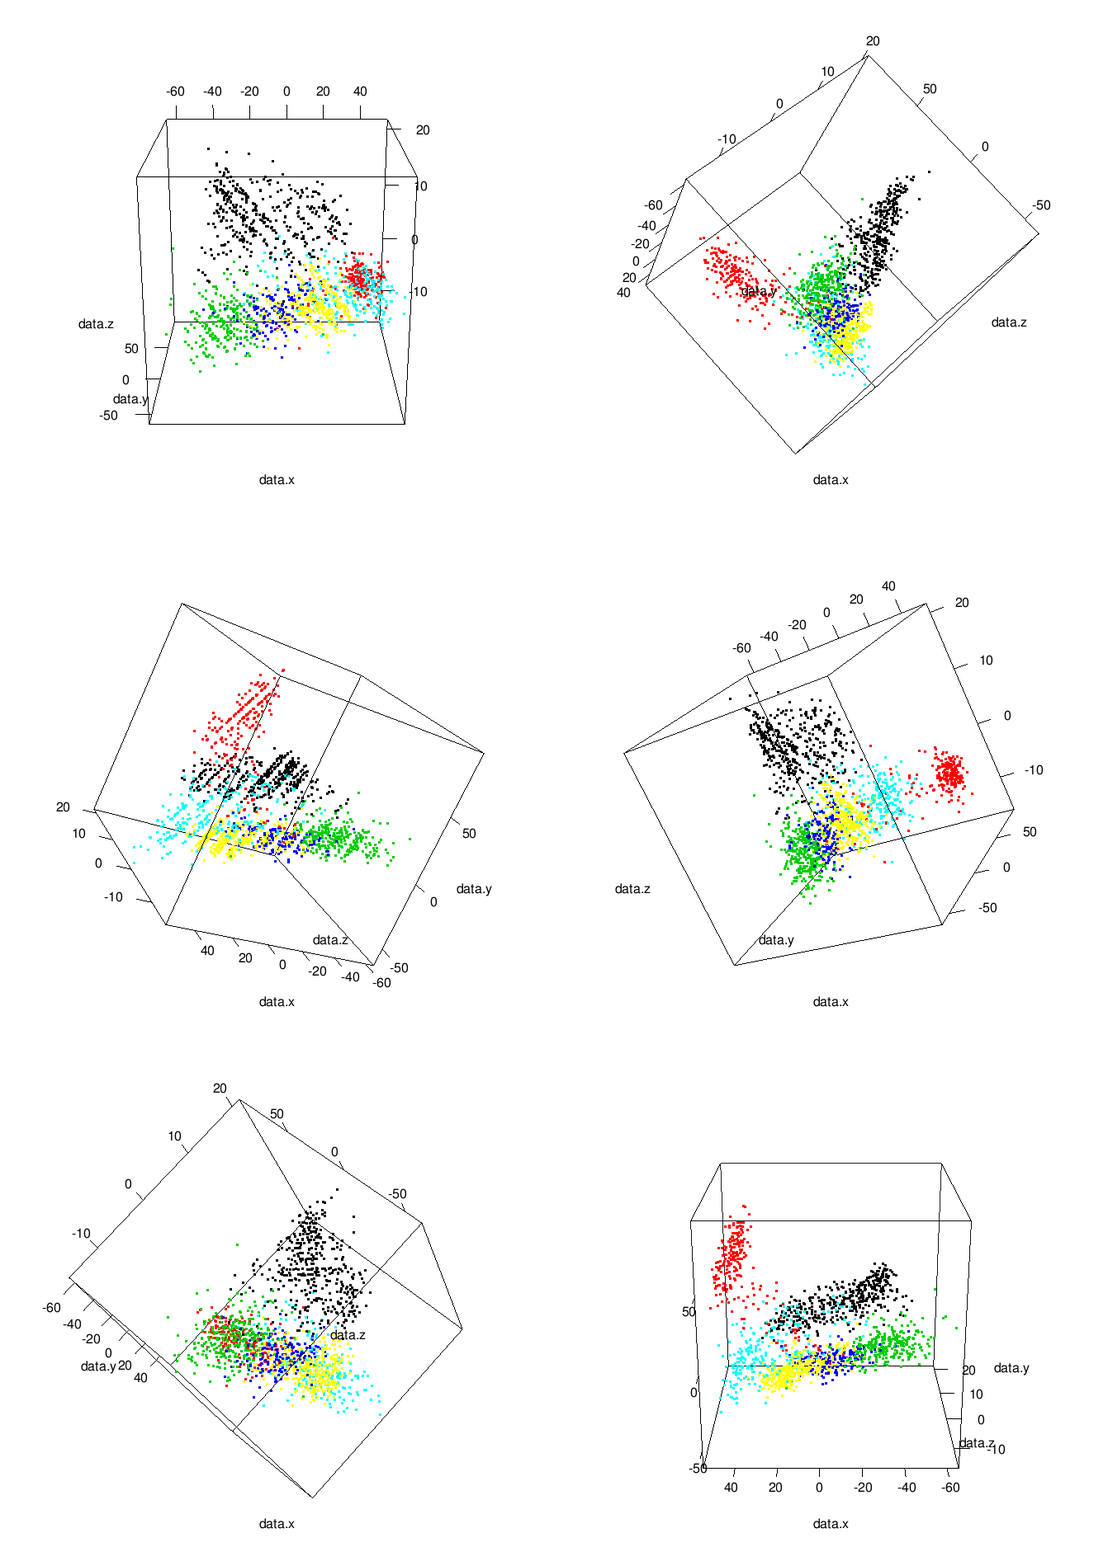 | |
| Animated 3-D MDS Plot |
Data from SatLog dataset, from the UCI Machine Learning Repository
Sunday, May 12, 2013
Physical Color Space
While working on the GIS project I described in this post, I had a presentation conundrum: how do I communicate my mapping of RGB (Red, Green, Blue (additive)) color space to ideology symbology to an audience that may or may not have only a passing acquaintance with the physics of color and how it relates to our current computer technology. To solve this issue, I decided I could physically model RGB space as a cube.
The cube allows one to examine the outer surface of the RGB space; as well as illustrating the relationship between additive and subtractive spaces. In terms of my ideological representation issue, I was able to communicate that the 3-axes used to represent Red, Green, and Blue values could be relabeled to represent the percent of the vote supporting Conservative, Alternative, and Liberal ideologies.


Licensed under Creative Commons: BY-NC-SA
The cube allows one to examine the outer surface of the RGB space; as well as illustrating the relationship between additive and subtractive spaces. In terms of my ideological representation issue, I was able to communicate that the 3-axes used to represent Red, Green, and Blue values could be relabeled to represent the percent of the vote supporting Conservative, Alternative, and Liberal ideologies.
Now I’m sharing, so you can make your own. You’ll need:
- a color printer or access to one.
- some poster board or other heavy (but flexible) art board
- an Xacto knife or other cutting implement.
- a ruler
- a pencil
- glue-stick, or other paper adhesive.
After printing, cut out and trace on to the art board one of the following PDFs (remember to add tabs if using the original PDF):
- Here’s the original PDF;
- and if you want to hide the edges, here’s one with tabs.
Next, you’ll cut out and fold the art board into a cube being sure to tuck the tabs in, so you have a more-or-less smooth external surface.
Then you’ll want to do the same with the color print-out, only this time gluing it to the art board cube you’ve assembled. (Again, remember to tuck any tabs underneath.)
Optionally, you may attempt to cover your creation with a protective covering (this usually doesn’t go as well as one would like — I wrapped mine in packing tape, but it got blisters and a tiny patch of color torn, etc.)
Cube size is approx. 2.75"^3Licensed under Creative Commons: BY-NC-SA
Friday, May 10, 2013
Introductory Political Economics with ArcGIS
For my final Project in a GIS course I took I looked at the shifting economic fortunes and political ideology on a geographic basis.
First, politics:
I was curious how American political ideology had changed amongst the populous since 1980. (The data to do this was hard to get under the time constraints I had, so I revised it to between 2000 (i.e. before "terrorist" was a word one heard or read all too often) and 2010.) I looked at congressional district election returns as a proxy for ideology of the populous for several reasons: (1) congressional elections are the most "local" political race with national coverage, (2) they are easier for minority parties to be contenders in, and (3) due to their diversity of views and their "locality" they may be more representative. After researching more than 40 political parties' platforms, I associated values [-1, 0, +1] and labeled them as "Left/Liberal" (socially-progressive, pro-big government; +1), "Right/Conservative" (socially-conservative, anti-government; -1), and "Centrist/Alternative" (Greens, Independents, Unknowns; 0). I then produced the following maps in ArcGIS, summing the values (after weighting them by percentage of election returns) to color them (positive numbers, blue; negative numbers, red; zero, light yellow).
 |
| US Ideology 2000 |
 |
| US Ideology 2010 |
Next, Income:
I then looked at income data on a county level from the Census Bureau. Because averages can be drastically skewed by outliers, I specifically looked at median income. I was also interested in poverty so I looked to incorporate this into my economic measurements. What is the poverty threshold? Well, that depends who you ask; and if you ask the Census Bureau, it depends on the number of dependents in the household. Faced with a dilemma of which number to use, I chose the Census Bureau figure for a household of 3; this was $13,738 in 2000 and $17,374 in 2010. I then calculated the percentage of median income above these numbers, thus a low or negative percentage would indicate the median income of the county was close to or below the selected poverty threshold, and a large number would indicate how far above this threshold the median income of the county was. For example, a county with a 200% figure would indicate a median income of $27,476 in 2000. I symbolized this information as five greyscale bins (darker greys are lower (percentage) values):
 |
| US % of median income above poverty, 2000 |
 |
| US % of median income above poverty, 2010 |
Overlay & Conclusions:
We can overlay these maps by year to get a composite view of Ideology and Income:
 |
| Composite Map, 2000 |
 |
| Composite Map, 2010 |
In conclusion, we can say there has been a shift to the political Right between 2000 and 2010; and, despite the Great Recession, people seem to be doing a little better economically. However, there are some flaws in my methodology and there are many complex economic interactions that could serve to make it seem like there is an improvement in income. For example, inflation wasn't explicitly taken into account, so incomes may have risen, but their purchasing power may have stagnated or gone down. Further, the symbology of the ideology maps confuses situations in which voters voted for an alternative party and where near equal number voted for opposing parties (.i.e. increased polarity). Another way to symbolize them would be to assign the percentage of votes for each ideology as RGB (Red-Green-Blue) percentages (of 255). Doing so, we would get the following maps:
 |
| US Ideology 2000 as RGB |
 |
| US Ideology 2010 as RGB |
These can be hard to interpret, due to the average human's ability to perceive color differences. Further work awaits.
Saturday, February 16, 2013
Coordinates for US counties
A week or two ago an e-mail from a map cataloger looking for a list of bounding box coordinates for US counties caught my eye. Reading the discussion that followed it was quite clear if anyone had thought to make such a digital list in the library community, it was suffering from terminal bureaucratic paralysis (death-by-committee) that is despairingly common in the library world (but this is a discussion for another post).
I knew where some suitable data could be obtained and had been itching to toy around with some geospatial python, so looking through Python Geospatial Development I found some starter code. Modifying this starter code and manually correcting a couple small anomalies I have produced a list [link] of US counties and their bounding box coordinates. I have attempted to make it easy for catalogers to just copy and paste the partial fields. The file is UTF-8 encoded, sorted by state and then county, basic metadata is given at the start of the file.
I knew where some suitable data could be obtained and had been itching to toy around with some geospatial python, so looking through Python Geospatial Development I found some starter code. Modifying this starter code and manually correcting a couple small anomalies I have produced a list [link] of US counties and their bounding box coordinates. I have attempted to make it easy for catalogers to just copy and paste the partial fields. The file is UTF-8 encoded, sorted by state and then county, basic metadata is given at the start of the file.
Friday, October 7, 2011
Back to the Academy
So, I have returned to school in hopes of securing a subject master's degree in Computer Science along with a graduate certificate in Applied GIS. Ideally I would like to also take classes in education and business as well, currently both time and money are limited, so we'll see. By the way the poverty of posts here should be taken as an indication that I am (a) busy with school work, (b) working on something so engaging and interesting I have temporarily forgotten I have a blog, or (c) I had to help a friend save the world from certain doom. I also have the problem of not wanting to post incomplete ideas/data.
Ciao.
Ciao.
Wednesday, March 16, 2011
Maps in Film: Lost Girl
A while back, I was watching the Canadian TV series Lost Girl [imdb]. In the episode ten ("The Mourning After") the location of a precious object is thaumaturgically ascertained, or more accurately, discovered via map dowsing.

Of course, map dowsing requires a map and when I see a map in film, I always wonder whether it is a real or fictional map of a real or fictional place. Well, in this case it is a real map of the Niagara Gorge. The map is a 1912 topographic map produced cooperatively between the Geological Survey of Canada and the United States Geological Survey (close-up below).

A copy of the map resides in the University of Toronto's Map Library [link] and has been enabled for digital access [link]. It seems reasonable to suggest that the map seen on screen is a copy of UT's, especially considering that the show is filmed in Toronto.
Of course, map dowsing requires a map and when I see a map in film, I always wonder whether it is a real or fictional map of a real or fictional place. Well, in this case it is a real map of the Niagara Gorge. The map is a 1912 topographic map produced cooperatively between the Geological Survey of Canada and the United States Geological Survey (close-up below).
A copy of the map resides in the University of Toronto's Map Library [link] and has been enabled for digital access [link]. It seems reasonable to suggest that the map seen on screen is a copy of UT's, especially considering that the show is filmed in Toronto.
Tuesday, February 22, 2011
Searching WorldCat.org
Okay so you've found a reference to a book, author, musical performer, subject, etc. somewhere on the internet. You wonder whether a library near you has a copy, what materials on the subject exist, or what else this author, musician, etc has created. You could search participating libraries at worldcat.org as a part of the sleuthing process by using OCLC/WorldCat's search add-on for your web browser. Oh, wait that only works in Firefox....
For those of you who don't want to make your Firefox search add-on list any longer, or don't even use Firefox, you can drag this link to your bookmarks toolbar, select some text on a web site, click the bookmark and be taken in a new window/tab to WorldCat results. It is a hack, but can be easily refined in a number of ways, if one wished. It works for me the way it is, with one little problem: selected text in a form field (and probably within flash content) can't be used as fodder for the search.
Here is the code:
javascript:(
function%20getSelText(){
var%20txt='';
if(window.getSelection){
txt=window.getSelection();
}
else%20if(document.selection){
txt=document.selection.createRange().text;
}
else{
return;
}
newSearch=window.open(%22http://www.worldcat.org/search?q=%22+txt);
}
)();
function%20getSelText(){
var%20txt='';
if(window.getSelection){
txt=window.getSelection();
}
else%20if(document.selection){
txt=document.selection.createRange().text;
}
else{
return;
}
newSearch=window.open(%22http://www.worldcat.org/search?q=%22+txt);
}
)();
Wednesday, February 16, 2011
Abuhachi torazu 「虻蜂取らず」
Abuhachi torazu 「虻蜂取らず」 is an idiom found at the beginning of Kodansha's Dictionary of Basic Japanese Idioms, it means literally to catch neither the horsefly nor the bee; in other words try to do two things at once and fail at both. Deconstructing it we have: Abu 「虻」'horsefly' + hachi 「蜂」'bee' and a form of toru「取る」'take in the hand; acquire'. This is to say I feel I have too many different interesting scholarly projects going and I'm feel as though I am failing at them all.
Saturday, December 18, 2010
CSS frustrations
So the other day while working on a bit of HTML I needed the semantics of an ordered list but the greater style possibilities of an unordered list without introducing scripting. Ultimately, I worked out a work around but it got me thinking about how the web is about letting anyone publish a document and how it seemed CSS as it currently stands occasionally restricts unnecessarily the creative freedoms the web was created to encourage.
Meditating on the issue the obvious solution seemed to be a generic way to define a list style type and then have the author or generator include the appropriate definition in the stylesheet. However, since I [mistakenly] believed the CSS 3 standard to be closer to at least 'proposed recommendation' status than it actually is, based foolishly on the rash of CSS 3 books recently published or in pre-pub, I proposed a solution that I thought might be easier to get included at such a stage.
Doing a little digging I found that proposed additions and changes were submitted via the www-style mailing list. I could not find an up-to-date draft of the CSS 3 standard, so I assumed the latest documents were restricted to W3C members, in order to keep too many cooks from spoiling the meal, so to speak, and continued with proposal for the less elegant solution.
Shortly after submitting my proposal I received a reply from one of the editors that they were presently editing the list module of the standard and already introduced the more elegant solution: @list-style-type as a generic way to define list style types and one that went beyond my use cases. Excellent!
I can hardly wait for a near finished CSS 3 to begin getting implemented!
Meditating on the issue the obvious solution seemed to be a generic way to define a list style type and then have the author or generator include the appropriate definition in the stylesheet. However, since I [mistakenly] believed the CSS 3 standard to be closer to at least 'proposed recommendation' status than it actually is, based foolishly on the rash of CSS 3 books recently published or in pre-pub, I proposed a solution that I thought might be easier to get included at such a stage.
Doing a little digging I found that proposed additions and changes were submitted via the www-style mailing list. I could not find an up-to-date draft of the CSS 3 standard, so I assumed the latest documents were restricted to W3C members, in order to keep too many cooks from spoiling the meal, so to speak, and continued with proposal for the less elegant solution.
Shortly after submitting my proposal I received a reply from one of the editors that they were presently editing the list module of the standard and already introduced the more elegant solution: @list-style-type as a generic way to define list style types and one that went beyond my use cases. Excellent!
I can hardly wait for a near finished CSS 3 to begin getting implemented!
Tuesday, November 16, 2010
The 6-Year Old Librarian
When I was about 6-years old, I decided I was going to run a library out of my closet. I was reminded of this the other day, when, as I was unpacking some of my books that had been in storage, I came across two Little Golden Books with spine labels displaying "call numbers." Additionally, in one I found part of an index card pasted (!) in the front — obviously for the due date.


I believe I have deciphered (most of) my "call number" scheme: the "CB" probably stands for "Children's Book" and following two digits are from a small number on the cover, finally the "GB" stands for "Golden Book". The rest of the characters are a bit of a mystery.

Subscribe to:
Posts (Atom)